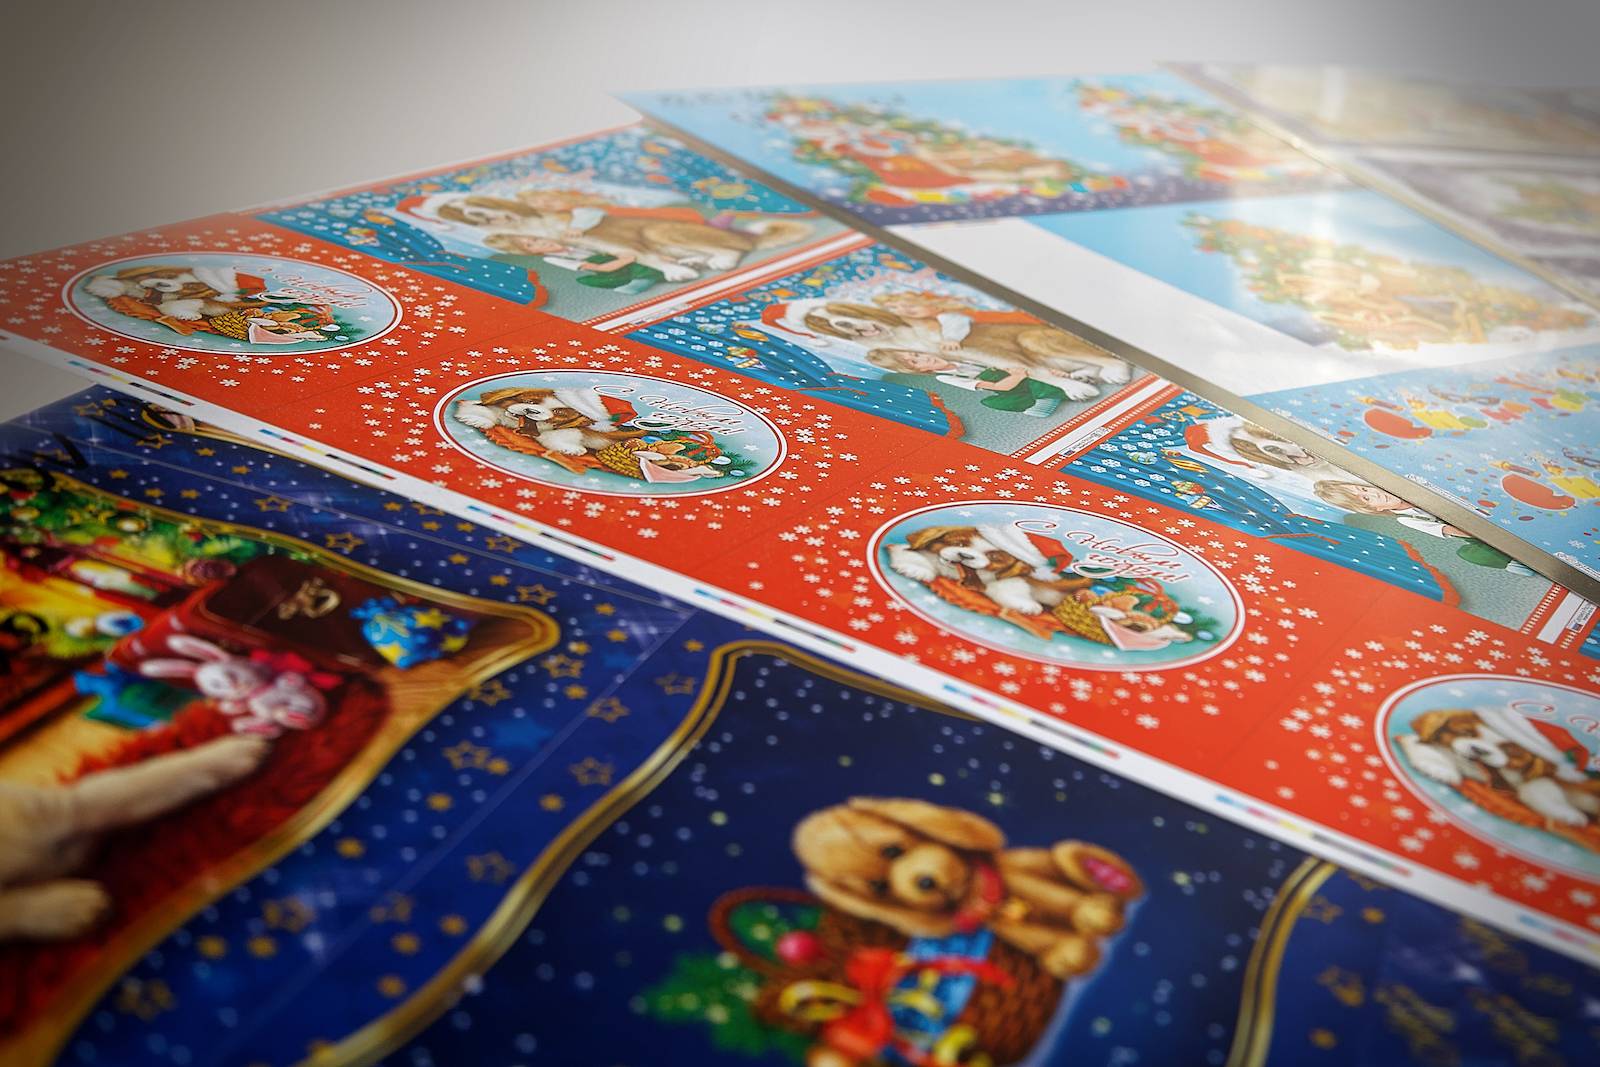
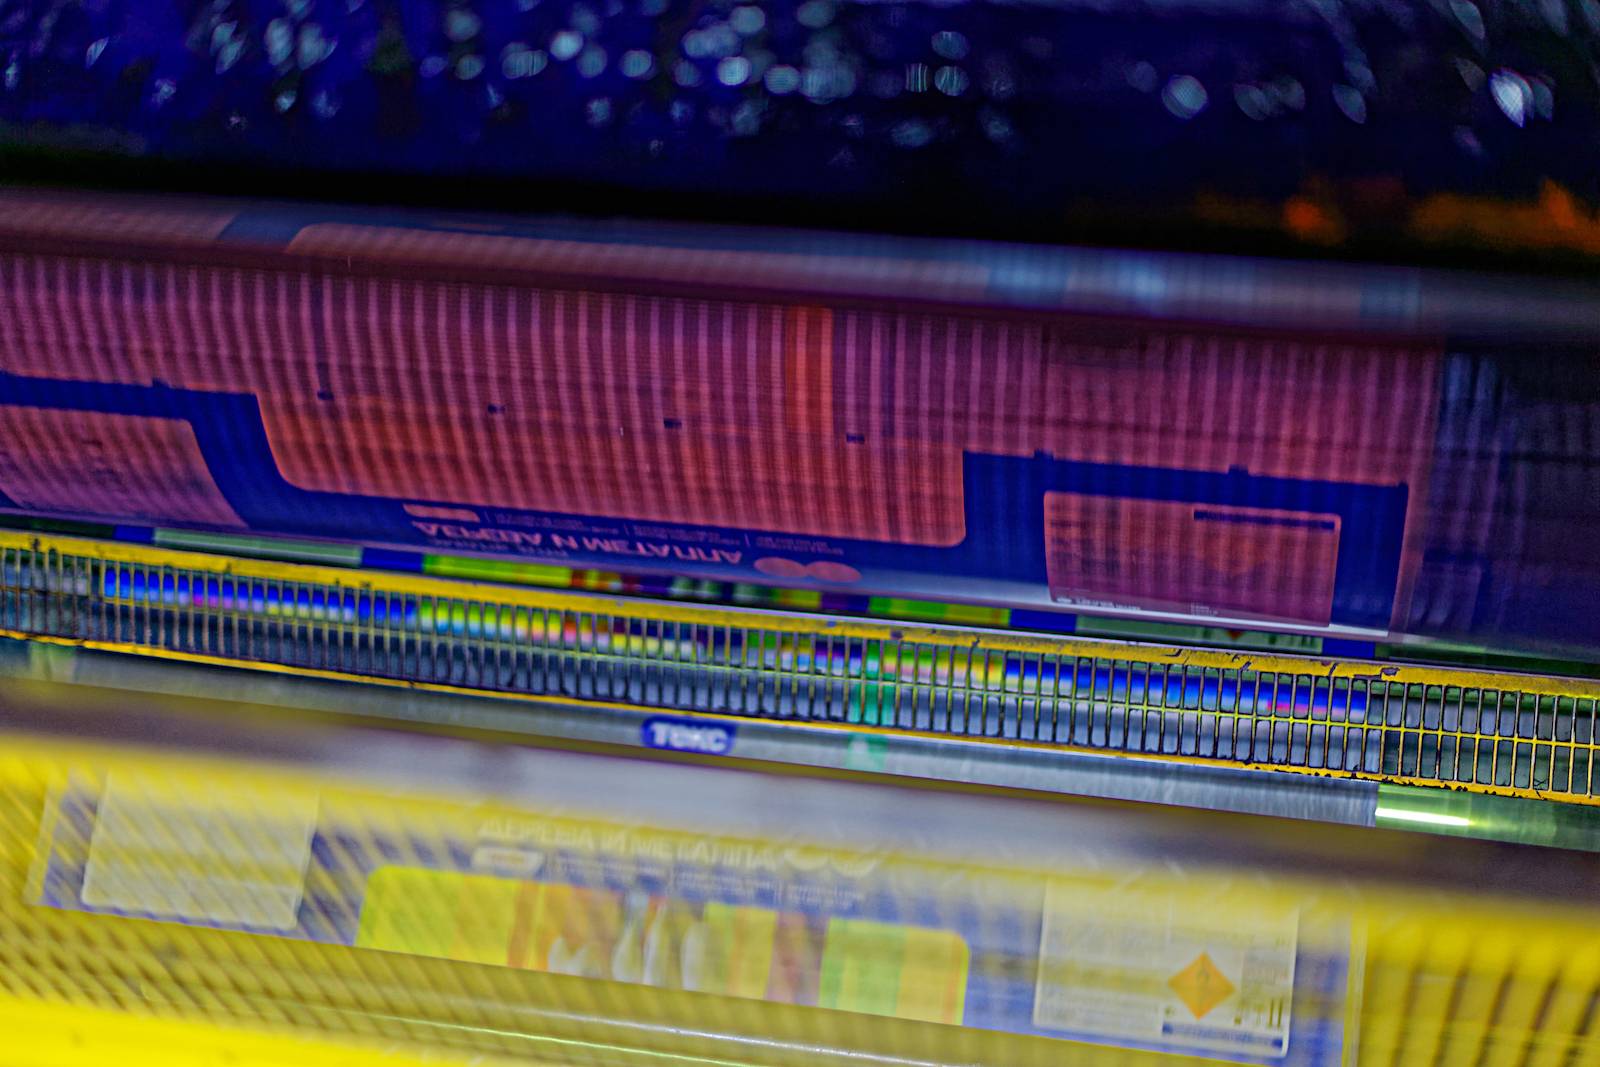
КРОНА - лакирование и полноцветная печать на жести и алюминии
ООО "КРОНА" - современный комплект лакирования и печати
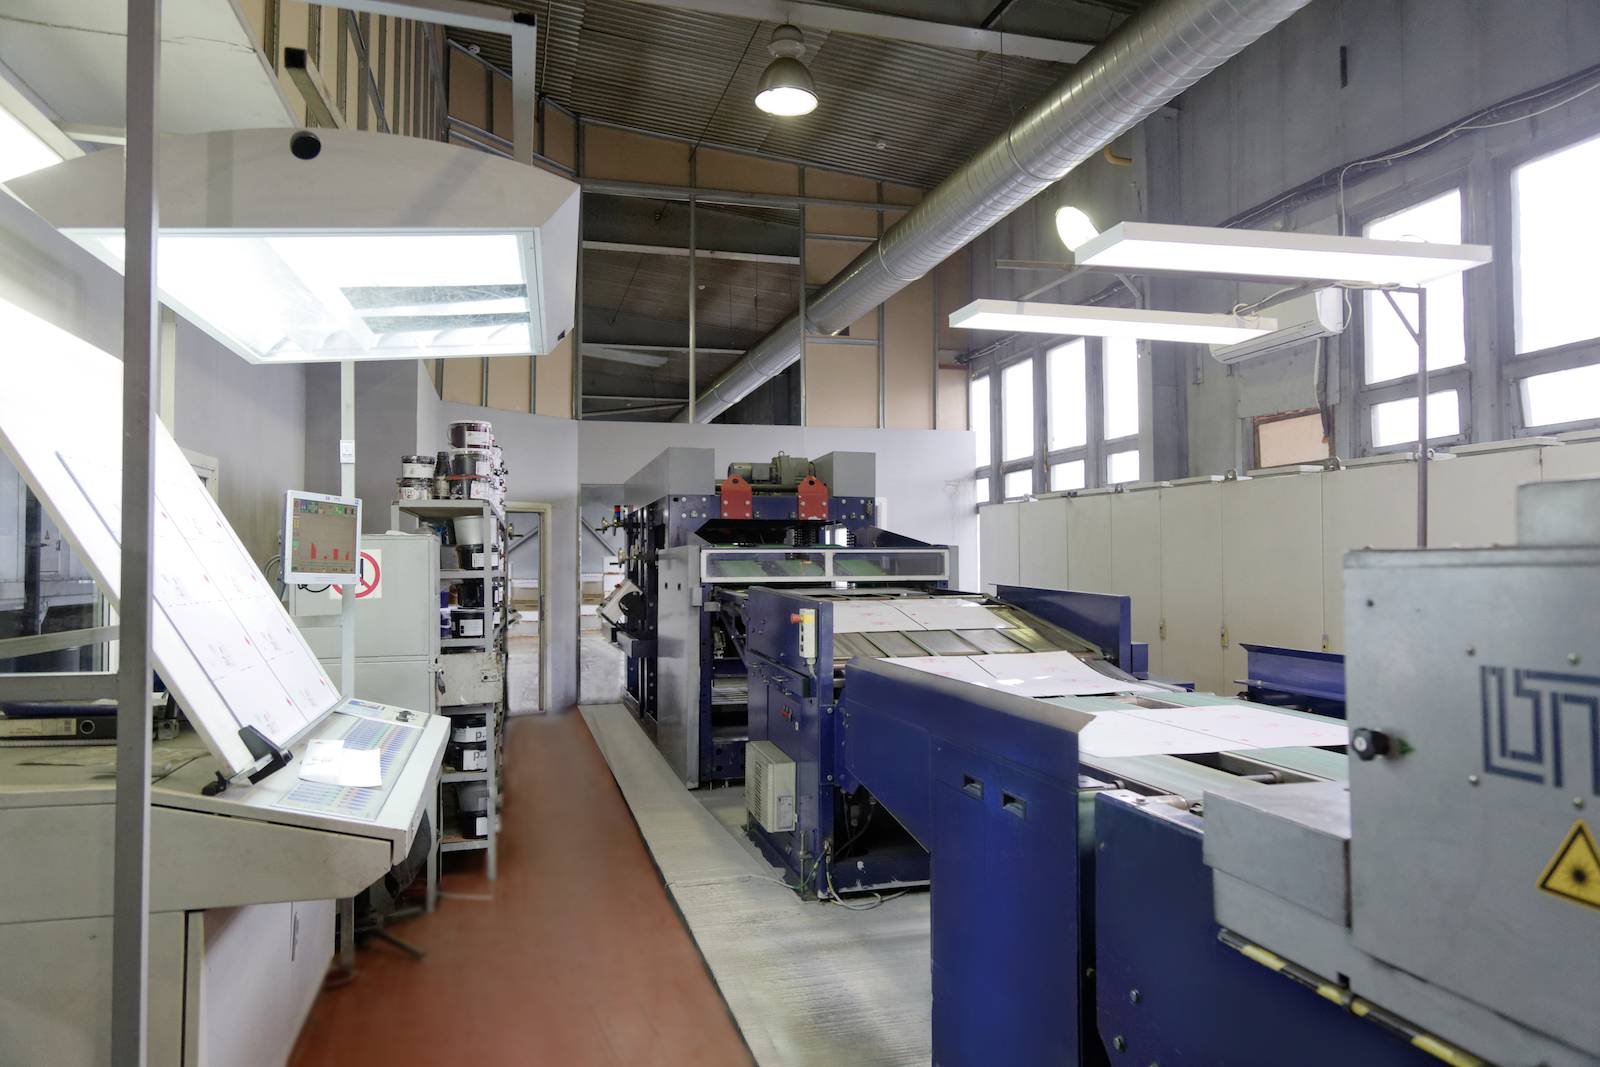
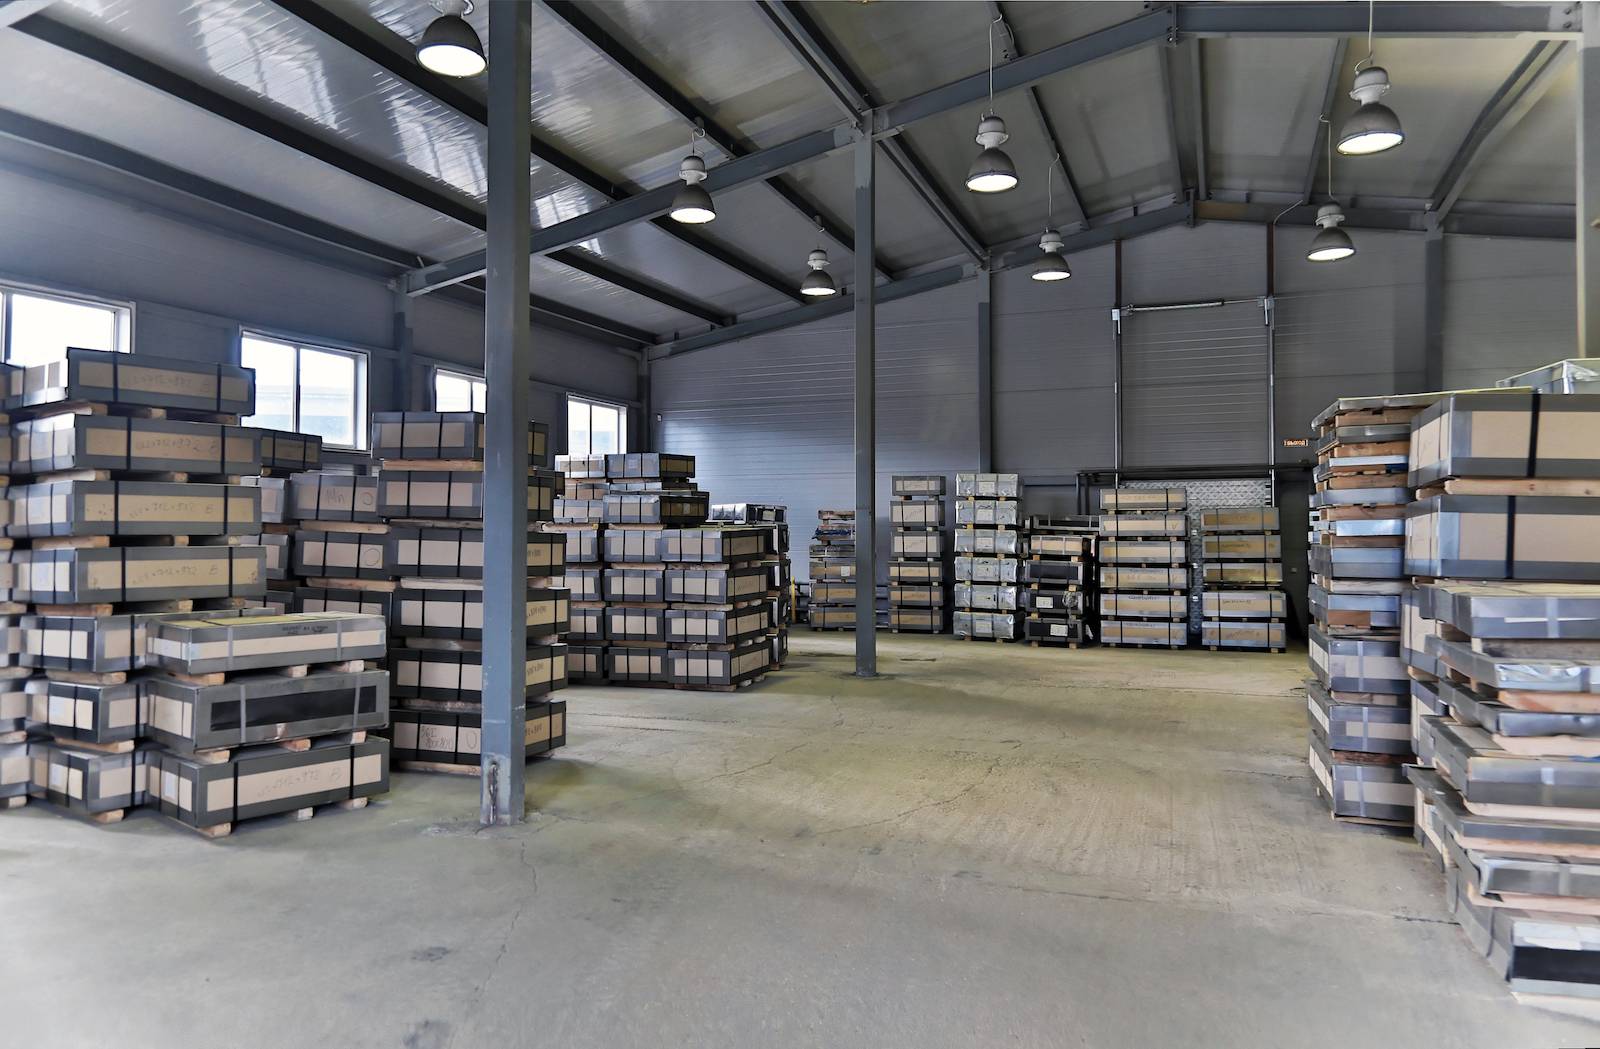
КРОНА - современный экологически безопасный комплекс по оказанию услуг лакирования и полноцветной печати на жести и алюминии, оснащенный специализированным оборудованием и использующий передовые технологии.
Основные направления деятельности компании:
- литография жести;
- лакирование жести;
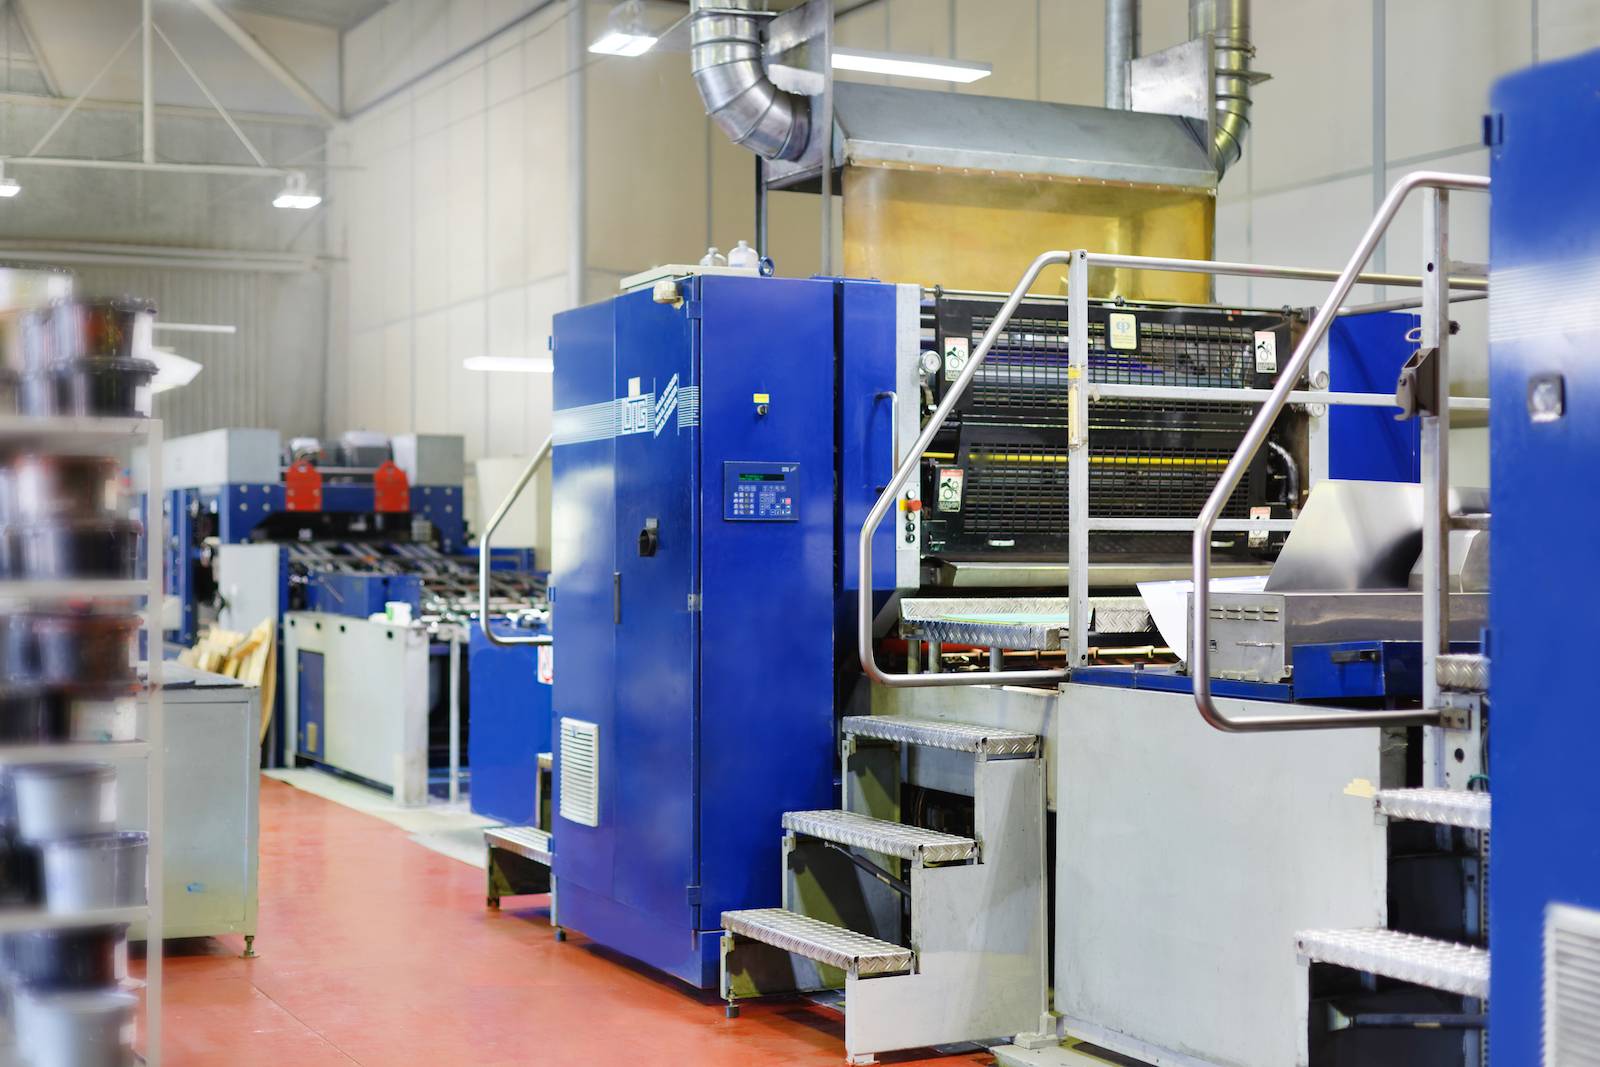
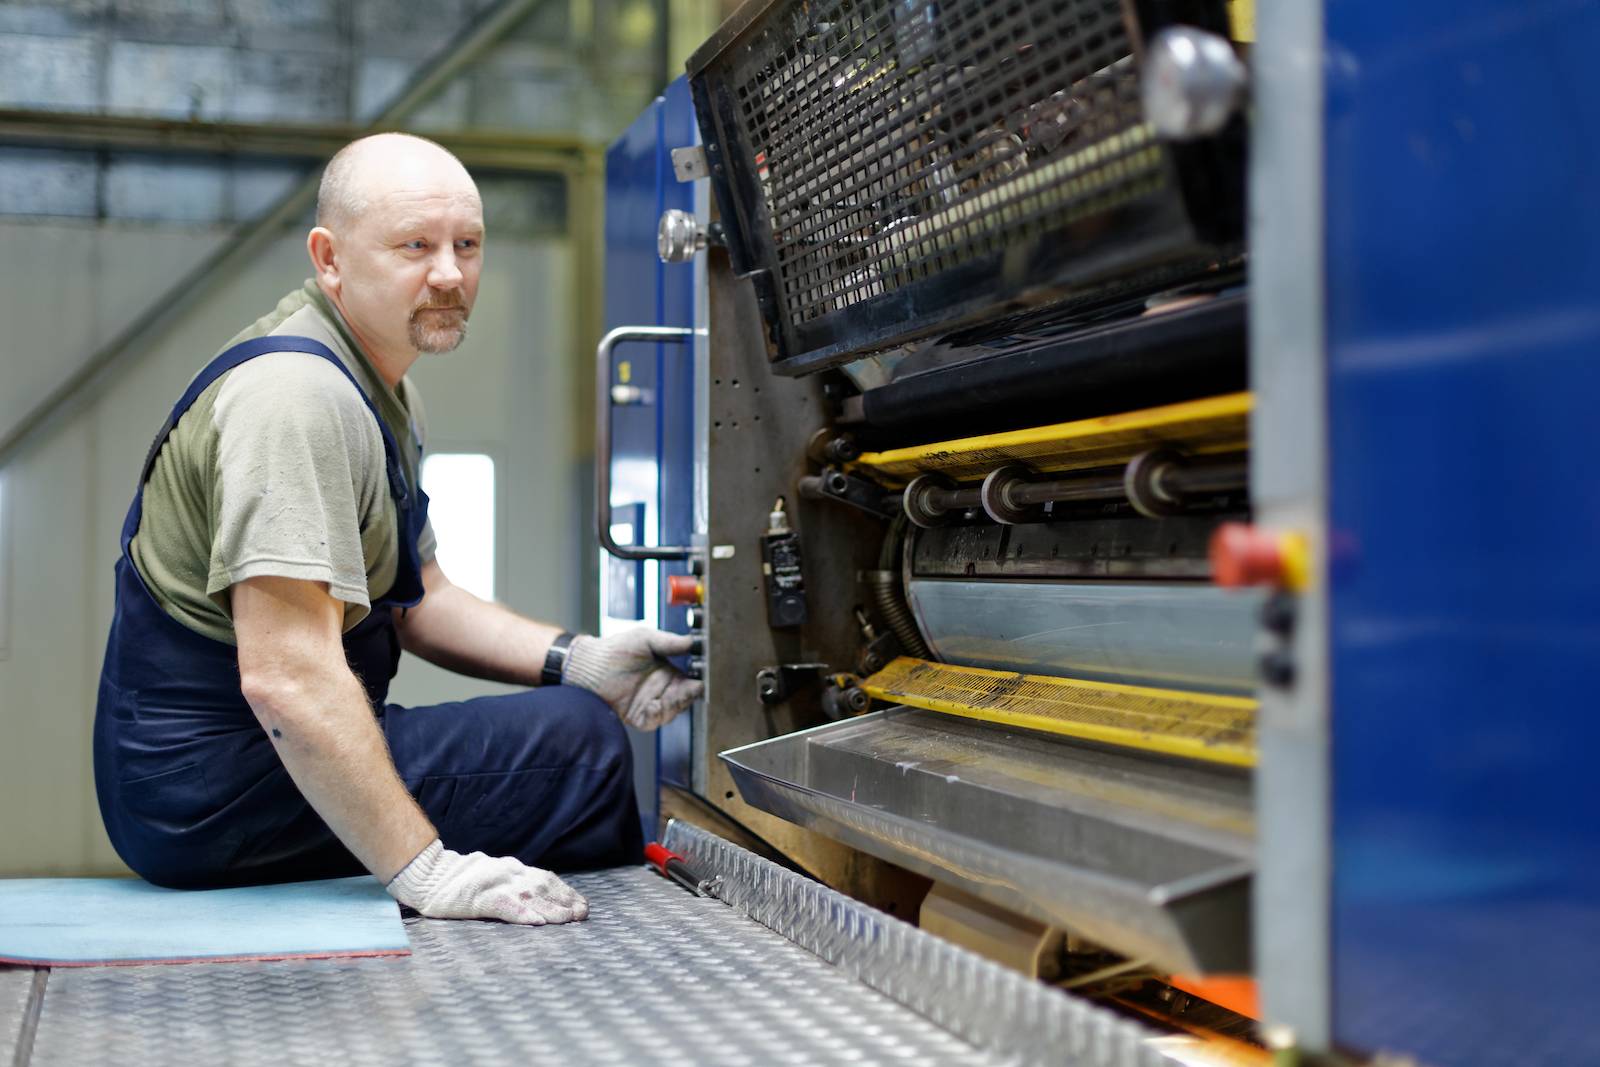
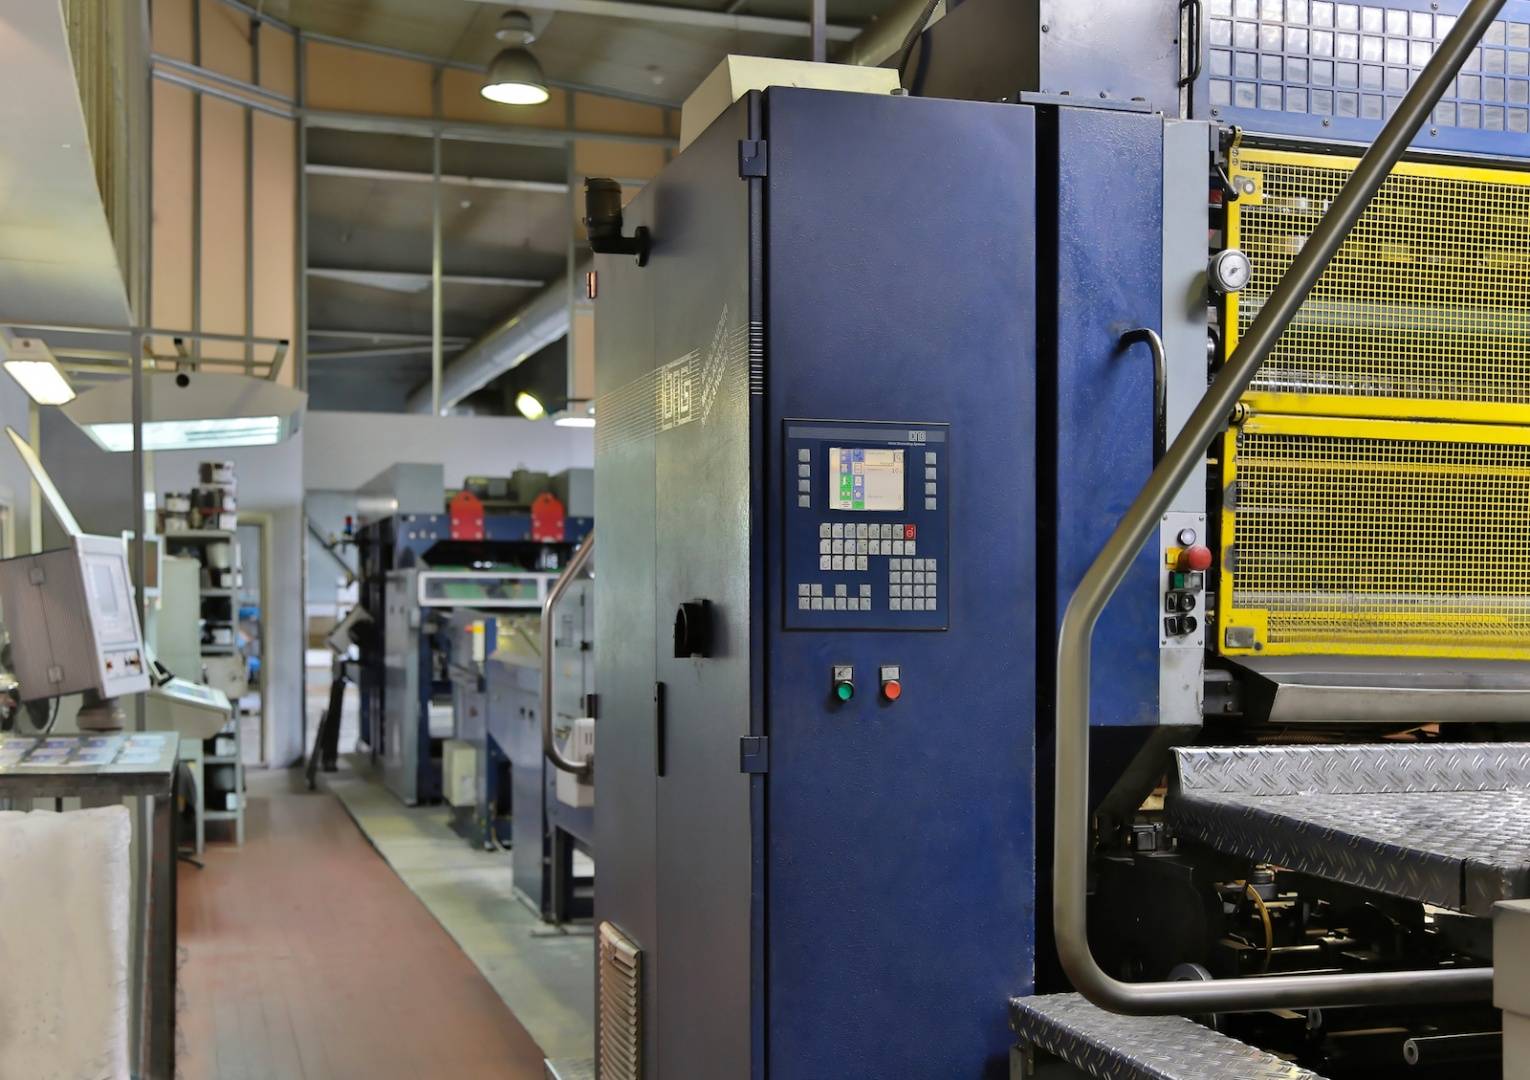
Наша компания использует современное высокотехнологичное оборудование.
Схема проезда
Офис: г. Тверь, пр-т Н.Корыткова, д.45, помещение 2
Производство: г. Тверь, ул. Коминтерна, д.95а
загрузка карты...
Задайте вопрос или оформите заявку